Recruit Top Agents. Quantify Commission Opportunity.
Identify high-performing agents, see where commission pools are expanding, and prioritise recruitment down to suburb level.

Why this matters for real estate recruiters
No transparency
Stop guessing based on candidate resumes. Reveal who is actually producing commissions across Australia, using structured evidence rather than noise.
Too much guesswork
Commission density varies by suburb and region. Identify the wealthiest markets in real time and target where the top billings actually sit.
Market churn
Don’t miss the shift. See where recruitment is heating up and move early as listings go live and competitors start circling.
How it works
Structured. Normalised. Recruitment-ready.
Ingest a complete listing dataset
Upload the structured CSV. Missing prices are imputed using median values by bedroom count. Commission estimates are calculated and embedded. Lat/long coordinates are appended. The file is normalised for interrogation — no manual cleaning required.
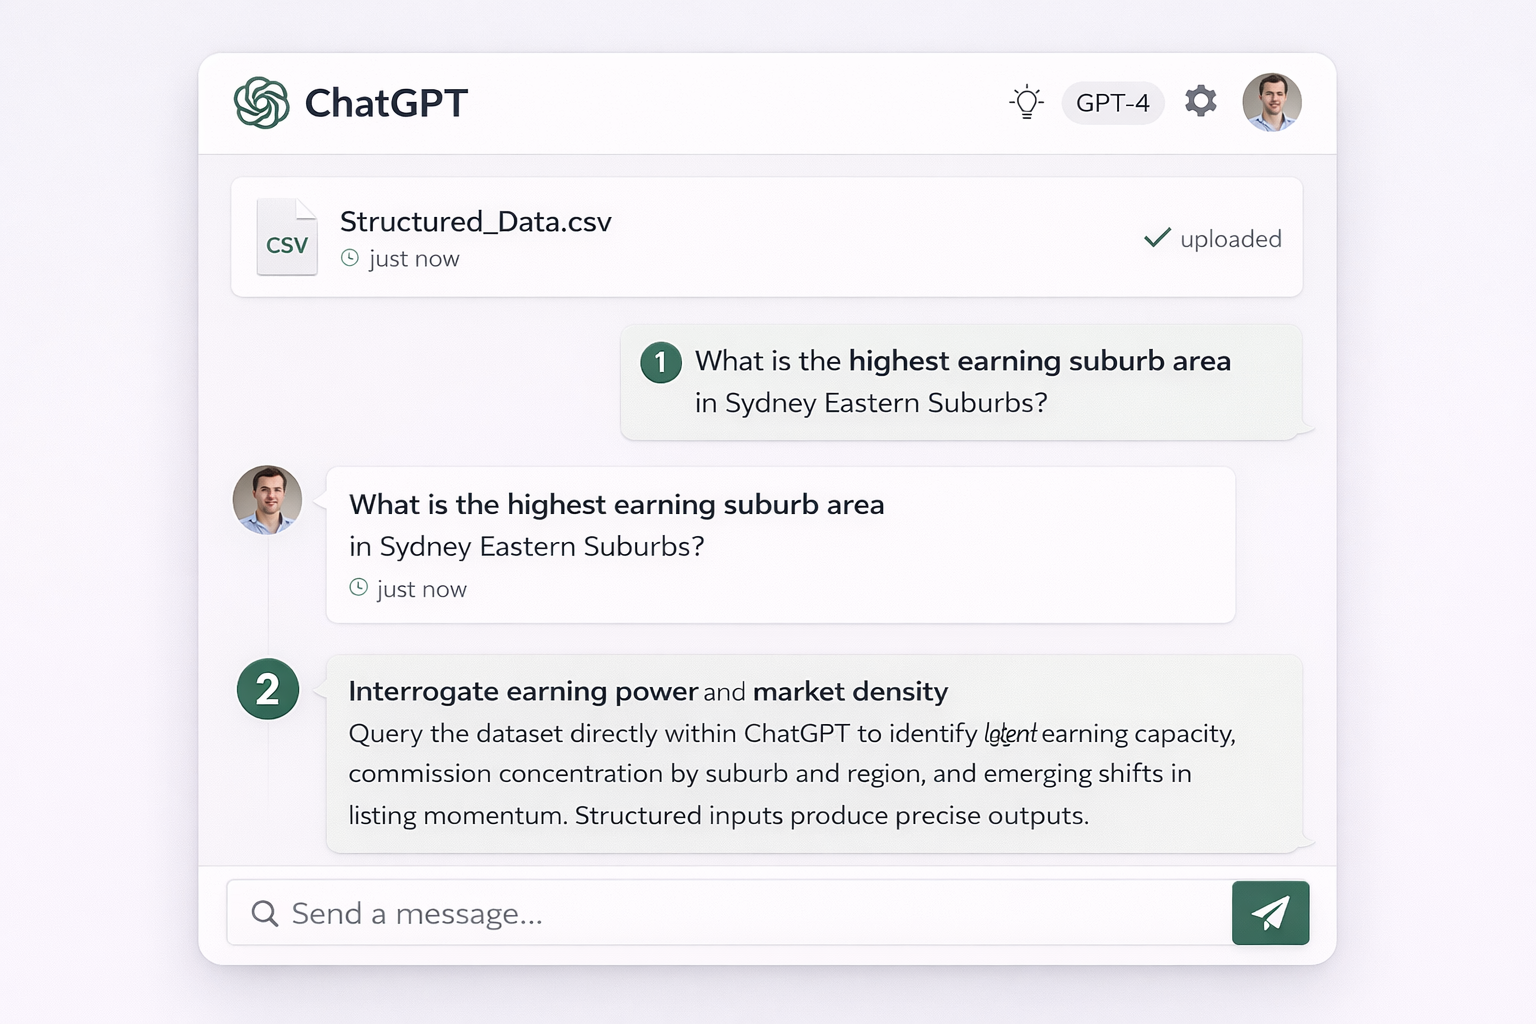
Interrogate earning power and market density
Query the dataset directly within ChatGPT to identify agent-level earning capacity, commission concentration by suburb and region, and emerging shifts in listing momentum. Structured inputs produce precise outputs.
Execute with evidence
Prioritise high-yield producers, target commission-dense markets, and move ahead of competitor awareness cycles. Recruitment decisions are anchored in data, not narrative.
Latest Research
Top 5 Yield Plays Where Rents Are Rising Faster Than Prices
Across five Australian SA3s—Latrobe Valley (VIC), Cardinia (VIC), Casey – South (VIC), Wyndham (VIC) and Sorell – Dodges Ferry (TAS)—rents are increasing more quickly than sale prices while stock on market remains elevated. This rent-led phase is lifting gross yields (around 4–5%) even as price growth is flat to slightly negative in places, creating conditions that favour disciplined buyers and investors prioritising income. Affordability is comparatively supportive in the Victorian growth corridors, while Sorell – Dodges Ferry sits tighter on rent affordability and slightly higher on buy multiples. Unless inventory clears meaningfully, expect pricing power to remain subdued and yields to carry returns over the coming months. This page profiles each area with concise location context and investor-relevant markers to guide research and conversations with clients.
Westfield: The Lifestyle Powerhouse Driving Property Demand
Why is Westfield a Favourite Among Top Real Estate Agents?
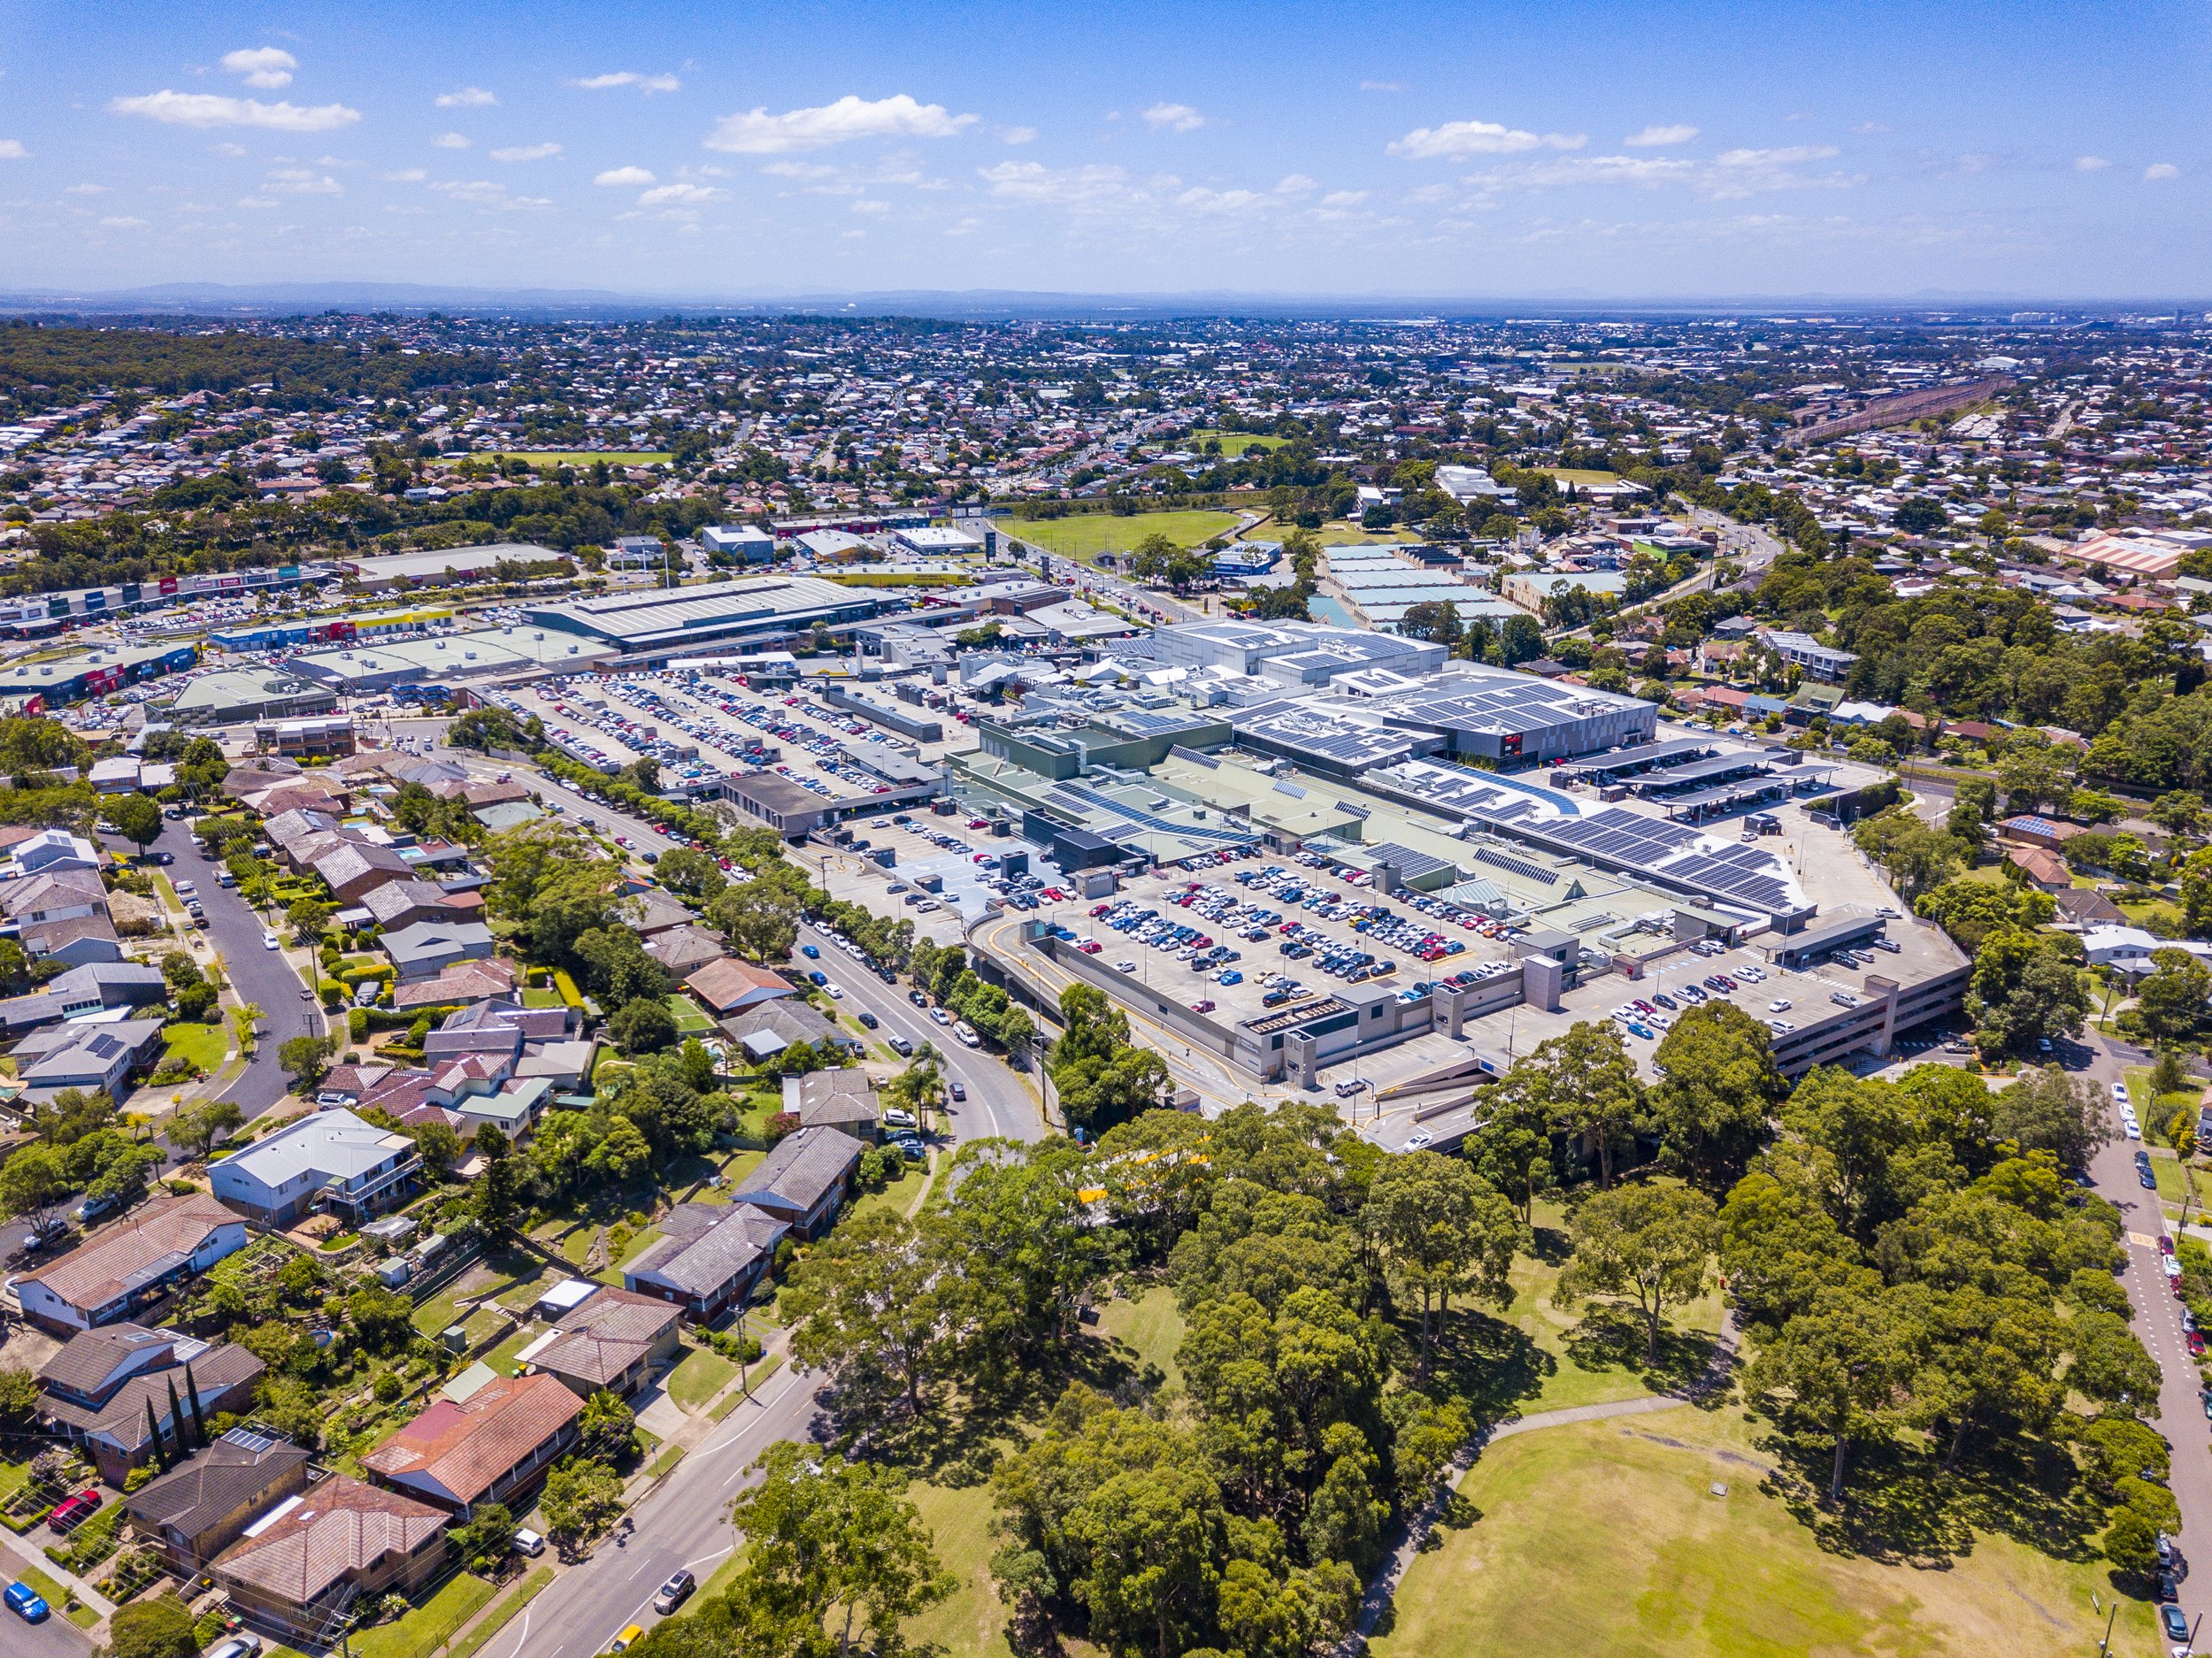
Westfield centres consistently rank as top lifestyle destinations, with 13 centres ranked #1 and 8 ranked #2 in Suburbtrends' Area Hotlists. This article explores why Westfield is so frequently mentioned by top real estate agents and how these centres enhance property listings. From unmatched convenience to vibrant community spaces, discover how Westfield’s appeal boosts the value of properties and why savvy agents leverage its prominence to attract potential buyers and renters.
Your Questions, Answered
-
Each weekly file contains a structured, listing-level dataset designed specifically for recruitment analysis within ChatGPT.
Every included property must have a clear, verifiable street address. Listings without a confirmed address are excluded to ensure geographic precision.
For each listing, the dataset includes:
• Full street address and suburb
• Geocoded latitude and longitude
• Assigned SA2 (Australian Bureau of Statistics local market area)
• SA4, State and National identifiers
• Bedroom count and key property attributes
• Estimated sale price (or median-by-bedroom backfill where price is absent)
• Tier-based commission percentage
• Calculated indicative commission estimate
• Agency and agent attribution
• Listing date fields for recency analysisBecause each record is geocoded and mapped to its SA2, recruiters can analyse earning density at a true local market level — not postcode approximations or marketing labels.
The file is normalised and formatted for direct upload into ChatGPT. No additional cleaning or modelling is required.
-
Commission estimates are applied using a structured, tiered percentage model aligned to prevailing Australian residential norms.
The current indicative rate structure is:
Up to $500,000 → 2.5%
$500,001 – $750,000 → 2.2%
$750,001 – $1,000,000 → 2.0%
$1,000,001 – $1,500,000 → 1.8%
$1,500,001 – $2,000,000 → 1.7%
$2,000,001 – $3,000,000 → 1.5%
Above $3,000,000 → Negotiable (1.5% or lower)
Rates decline progressively across price tiers to reflect typical market behaviour in Australia, where higher-value transactions generally attract lower percentage fees.
Where listing prices are unavailable, estimated sale values are imputed using median sale values by bedroom count within the relevant geography. The appropriate commission percentage is then applied to that estimated value.
Each listing therefore contains:
• An estimated sale value
• A tier-based commission percentage
• A calculated indicative commission estimateThe model is designed to provide consistent, comparable earning-power analysis across agents, suburbs and regions. It is conservative by design and does not attempt to replicate individual agency fee agreements.
-
Active listing data and associated commission estimates are refreshed weekly.
Each weekly release reflects current live listings and recalculated commission exposure using the structured tier model. This ensures agent-level earning estimates and suburb-level commission density remain aligned with present market conditions — not lagging summaries.
The weekly cadence is deliberate. Recruitment advantage is driven by timing. Early identification of listing concentration shifts, emerging commission clusters and momentum changes enables recruiters to act before broader market awareness adjusts.
Historical back-series data is also available for longitudinal analysis and trend validation. However, the core dataset is optimised for current competitive positioning.
The objective is actionable recency — supported by historical depth where required.
-
Only listings with a clearly identifiable street address are included in the dataset.
Listings without a verifiable address are omitted to maintain geographic precision. Each confirmed address is geocoded and assigned latitude and longitude coordinates.
Those coordinates are then matched to an SA2 (Statistical Area Level 2).
An SA2 is an Australian Bureau of Statistics geographic unit designed to represent a local community or market area. In metropolitan regions, SA2s typically reflect recognisable suburb clusters. They are materially more precise than postcodes and far more reliable than marketing labels.
By mapping every listing to its SA2:
• Commission density can be analysed at a true local-market level
• Suburb clusters can be compared consistently
• SA4, State and National roll-ups remain structurally coherent
• Geographic distortion from vague listing descriptions is avoidedThis structured geocoding process ensures commission analysis reflects real, locatable market activity — not approximations.
-
Yes.
In addition to the weekly live dataset, structured historical back-series files are available.
Back-series access allows recruiters to analyse:
• Agent earning consistency over time
• Commission density changes within specific SA2s
• Expansion or contraction of high-value corridors
• Short-term spikes versus sustained performanceHistorical files follow the same structured methodology as the current dataset, including:
• Median-by-bedroom price backfill where required
• Tier-based commission percentage application
• Address geocoding and SA2 assignmentThis ensures full comparability across time periods.
SA4 licences include recent historical windows.
State and National licences include extended back-series coverage.The purpose is not just to identify who is earning now — but to validate durability and trajectory before making recruitment decisions.
-
Licensing is structured by geographic coverage and organisational scale.
You can subscribe at three levels:
Single SA4 — $395 per month
State licence — $1,095 per monthNational licence (up to 50 agents) — $1,495 per month
National licence (50–100 agents) — $2,495 per month
National licence (100+ agents) — $3,495 per monthAll licences are billed monthly.
There are no lock-in contracts and no minimum terms.
Licences are organisation-based and intended for internal recruitment use.
You may upgrade between SA4, State and National tiers at any time. Organisations expanding their recruitment footprint can transition seamlessly without data disruption.
The structure ensures geographic clarity, fair usage alignment and scale flexibility.
-
No.
The dataset is delivered as a structured CSV file formatted specifically for direct upload into ChatGPT.
No dashboards, integrations or modelling tools are required.
Recruiters interact with the data using plain-English prompts such as:
• “What is the highest earning SA2 in Sydney’s Eastern Suburbs?”
• “Rank agents by estimated commission in Brisbane Inner.”
• “Show emerging commission density shifts in Melbourne’s south-east.”ChatGPT can also resolve naming inconsistencies within the dataset. Where agents or offices appear under slight spelling variations or branding differences, plain-English prompts can consolidate and normalise those entries for comparative analysis.
Because the dataset is geocoded and normalised in advance, AI can reconcile duplicates and surface precise comparative outputs without manual cleaning.
The system is designed for interrogation, not configuration.
-
Licensing is structured by geography and organisational scale.
Single SA4 — $395 per month
State licence — $1,095 per monthNational licence (up to 50 agents) — $1,495 per month
National licence (50–100 agents) — $2,495 per month
National licence (100+ agents) — $3,495 per monthAll licences are billed monthly.
There are no lock-in contracts and no minimum terms.
If you are not satisfied within your first month, we offer a 100% money-back guarantee. Simply notify us within the initial billing cycle and your subscription will be refunded in full.
The objective is long-term alignment — not contractual commitment.


